Flagging the “threat” posed by undocumented immigration, Prime Minister Narendra Modi last week said the country’s demography was being altered as “part of a deliberate and well-thought-out conspiracy”.
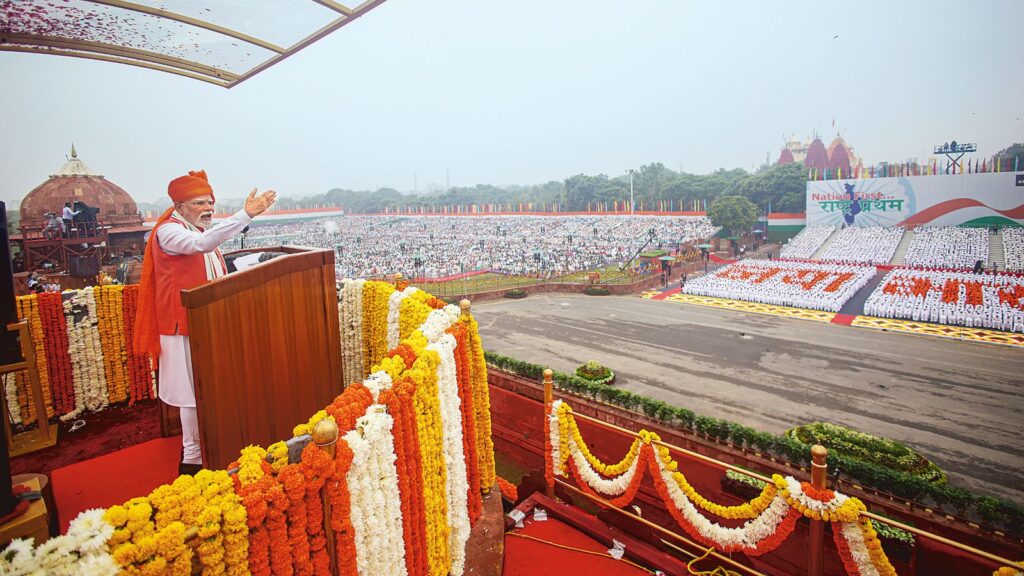
“When demographic change occurs, particularly in border areas, it creates a national security crisis. It threatens the unity, integrity, and progress of the country. It also sows the seeds of social tension. No country can hand itself over to infiltrators. No nation in the world does so — how then can we allow India to do so?” Modi said in his Independence Day speech last Friday while announcing a “demographic mission”.
An analysis of Census data over seven decades shows that while many border states, particularly in the Northeast and on the northern frontier, have often recorded above-average population growth, the pattern is far from uniform and in north India, the gap between border and inland states is often blurred.
Northeast and northern frontier lead, but with reversals
For much of the post-Independence period, northeastern states such as Tripura, Assam, Meghalaya, Manipur, Mizoram, Nagaland, Arunachal Pradesh, and Sikkim, along with Jammu & Kashmir in the north, recorded growth rates well above the national average.
Tripura posted a staggering 78.7% growth in 1951–61, coinciding with large-scale migration from East Pakistan (present-day Bangladesh). Assam recorded double-digit surges in several decades (35% in 1951–61; 34.9% in 1961–71). Nagaland, Mizoram, and Manipur experienced high growth rates (30%-60% per decade) into the 1980s before slowing; Nagaland even recorded a rare negative growth rate (-0.5%) in 2001–11, possibly due to out-migration or enumeration anomalies.
 The decadal population growth rate of northeastern states and southern states.
Jammu & Kashmir also sustained consistently high growth, often around the high 20s and low 30s per decade.
Yet, not all border\ states showed sustained overperformance. Himachal Pradesh’s rates hovered closer to the national mean in several decades, and Assam itself dipped below the national average in 2001–11.
Heartland matches border states’ growth
In the north, high growth has not been the preserve of border states. Heartland states such as Uttar Pradesh, Bihar, Rajasthan, and Madhya Pradesh consistently posted above-average rates, often rivalling or exceeding the border states.
Rajasthan, for example, recorded growth rates in the high 20s across many decades (28% in 1951–61, 29.1% in 1971–81, 28.3% in 1991–2001). Rajasthan, despite being a border state, shares demographic behaviour more akin to the high-growth heartland than the variable patterns of some other frontiers.
Gujarat, too, posted decadal growths between 24% and 27% till the 1991-2001 period. Same for Madhya Pradesh that has swayed from 21% in 1951-61 to almost 30% in 1971-81 and dipping back to the low 20s in 2001-2011.
Uttar Pradesh and Bihar also stayed well above the national average in several Censuses, reflecting higher fertility and lower urbanisation during that period. Barring 1951-61, when UP’s decadal growth stood at 13.8%, its decadal growth has remained over 25% in all subsequent decades, dipping to 20% in 2001-2011. Bihar, too, has remained in the range of 25%-30% since 1951-61.
 Decadal population growth of states since 1951.
Similarly, the trajectory of Punjab, a border state, has not been very different from many inland states, with population growth rising from the low 20s to the high 20s till the 1980s before declining to just 13 % in the 2001-2011 period.
The convergence of growth rates between inland and northern border states complicates any simple “border vs inland” generalisation in this region.
West Bengal: One exceptional decade
On the eastern frontier, West Bengal presents a different pattern. The state recorded its highest-ever decadal growth between 1951 and 1961, the only decade in which it exceeded the national average. That spike is linked to heavy post-Partition migration from erstwhile East Pakistan. In the three decades that followed (1961–91), Bengal’s growth stabilised at around 23%–24%, roughly matching the national average. From 1991–2001, the state’s growth rate dipped below the national average, reaching 13.8% in 2001–11. This trajectory sets it apart from many northeastern border states, which maintained high growth for longer.
Contrasts in southern states
The southern coastal states of Kerala, Tamil Nadu, and Andhra Pradesh experienced an early demographic transition marked by rapid fertility decline, rising literacy, and higher urbanisation.
Tamil Nadu, Kerala, Andhra Pradesh, and Karnataka generally moved earlier through the demographic transition. Kerala’s decline is most striking: from double-digit growth in early decades, it fell to 4.9% in 2001–11, well below the national average of 17.7% for that decade; Tamil Nadu also reported lower rates relative to the national mean in several decades. These reductions reflect faster declines in fertility, higher literacy and more extensive urbanisation and health coverage in the south.
Population surges and historical shocks
Several historical events reshaped the country’s demographic map. These included the Partition (1947) that brought large-scale population displacement into Punjab, West Bengal, and Assam. Early Censuses captured this churn. The Bangladesh Liberation War (1971) saw a surge in growth in Assam, Tripura, and West Bengal, correlating with refugee inflows.
Recent decades: Closing the gap, but not evenly
By 2001–11, the gap between high-growth frontier states and the rest of the country narrowed. Many border states slowed in line with the national trend, though some, particularly in the Northeast, still registered above-average rates.
The most dramatic shifts were in states such as Nagaland (negative growth) and Assam (drop below the national average). In contrast, high-growth inland states in the North continued to outpace much of the South and the West, underscoring the role of fertility patterns over geography alone.

